
Volumetric analysis of imaging data
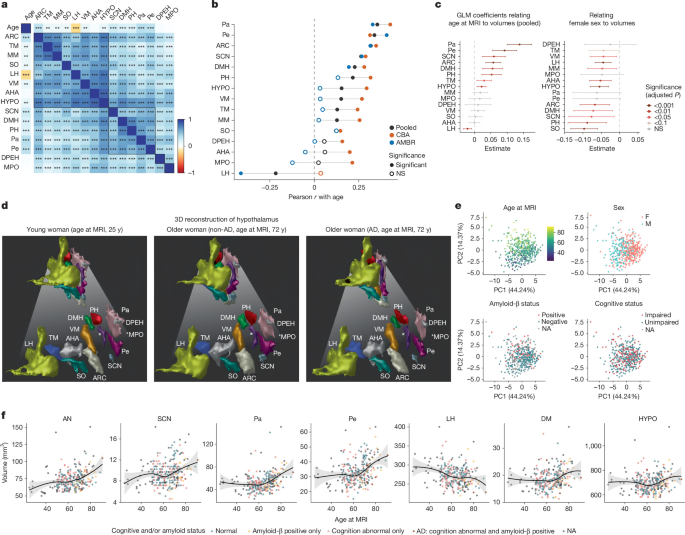
The brain MRIs used in this study were obtained from two separate datasets. The first came from the AMBR study16. A second dataset from the CBA study17 was added to improve rigor and reproducibility. Both studies obtained 0.8 mm isotropic T1 magnetization-prepared fast gradient echo and T2 sampling perfection with application-optimized contrasts using different flip angle evolution sequences for segmentation and volumetric analysis of specific hypothalamic nuclei, as described in ref. 15. Although there are several other high-resolution brain MRI datasets, the AMBR and CBA studies also obtained assessments of brain amyloid-β deposition and cognitive impairment. Differences in other aspects of the AMBR and CBA studies, such as cohort characteristics, were considered useful in improving the robustness and generalizability of this study. Test-retest reliability of the segmentation pipeline was assessed using ICC ((2.1; two-way random effects, absolute agreement, single measure) in eight participants with repeated analyzes in the CBA study. Following ref. 61we classified ICC < 0.40 as poor and between 0.40 and 0.59 as fair; we note that other diagrams, such as ref. 62set the poor-moderate limit to 0.50. For structures with poor ICC, we then corroborate the volumetric results with a complementary molecular modality. All associations reported here are based on bilateral volumes (combined left and right); Hemisphere-specific measures, which are inherently noisier, were examined only descriptively and did not form the basis of our conclusions.
To specifically assess the effect of AD on subregion volumes, participants were categorized based on their amyloid-β and cognitive status. Amyloid status was determined from amyloid positron emission tomography imaging or CSF biomarker assessments when available, using study-specific criteria: in AMBR, labeling was based on Knight Alzheimer Disease Research Center (ADRC) cutoffs for standardized uptake value ratio (SUVR) of (carbon-11)-Pittsburgh compound B (C-11 PiB), (fluorine-18)-florbetapir (F-18 AV-45) SUVR, by visual reading when SUVR data were not available, or by CSF test results. In the CBA study, labeling was based on provided centiloid values thresholded at 16.4, corresponding to the average Knight ADRC C-11 PiB cortical SUVR threshold of 1.42 (ref. 63). If amyloid-β status was positive at any time before or up to 1 year after MRI, it was considered positive. Conversely, if amyloid-β status was negative at any time after or up to 1 year before MRI, it was considered negative. Otherwise, amyloid-β status was considered not available (NA).
Cognitive status was labeled as “impaired” or “intact” using study-specific criteria. In the AMBR study, labeling was based on the Clinical Dementia Rating (CDR) scale, with CDR = 0 indicating cognitive impairment and CDR 0 indicating cognitive impairment. A subject was labeled as impaired only if assessed as impaired within ±1 year after MRI, and as unimpaired only if assessed as intact at any time after MRI or within 1 year prior (otherwise coded as NA). In the CBA study, labeling was based on the specific diagnostic code at a time point, with code 1 indicating cognitive impairment; codes 2, 4, 5, and 6 indicating signs of cognitive impairment and code 3 (subjective impairment) coded as NA.
In both studies, individuals meeting the criteria for cognitive impairment and positive amyloid-β status were designated as the AD group. Conversely, participants without cognitive deficit and with negative amyloid-β status were classified in the non-AD group (control). In order to minimize the risk of confusion linked to intermediate pathological profiles, only individuals clearly falling into these AD or non-AD categories were included in these specific comparative analyses. The cohort had a mean age of 63.4 ± 11.6 years (mean ± standard deviation) and included 60.5% women. Additionally, our dataset includes information directly relevant to AD, including 30.6% with abnormal cognitive status and 13.8% who were positive for amyloid-β (Extended Data Fig. 1a). The mean total hypothalamic volume for this cohort was 736.2 ± 88.2 mm3.
Because the dataset did not have predefined group structures for all desired comparisons, we used a GLM to assess associations between hypothalamic subregion volumes (summed in the left and right hemispheres) and various demographic and clinical variables.
More specifically, in the AMBR study (n= 202), we modeled (denoted “~”) the natural logarithm of the volume of each subregion (log (subregion volume)) as a function of MRI-scaled age, sex, cognitive status (cogn.), amyloid-β deposition status, and other relevant covariates, where “+” denotes additive main effects, “:” denotes interaction, “×” denotes cross-terms (effects main plus their interaction), and ‘scale()’ denotes z -standardization of the score of a covariate:
$$\begin{array}{c}\log ({\rm{v}}{\rm{o}}{\rm{l}}{\rm{u}}{\rm{m}}{\rm{e}})\sim {\rm{s}}{\rm{c}}{\rm{a}}{\rm{l}}{\rm{e}}({\rm{a}}{\rm{g}}{\rm{e}}\,{\rm{a}}{\rm{t} }\,{\rm{M}}{\rm{R}}{\rm{I}})+{\rm{s}}{\rm{e}}{\rm{x}}+{\rm{c}}{rm{o}}{\rm{g}}{\rm {n}}. rm{l}}{\rm{o}}{\rm{i}}{\rm{d}}.\,{\rm{s}}{\rm{t}}{\rm{a}}{\rm{t}}{\rm{u}}{\rm{s}}\+{\rm{c}}{\rm{o}}{\rm{g}}{\rm{n}}.\,{\rm{s}}{\rm{t}}{\rm{a}}{\rm{t}}{\rm{u}}{\rm{s}} :{\rm{a}}{\rm{m}}{\rm{y}}{\rm{l}}{\rm{o}}{\rm{ i}}{\rm{d}}.\,{\rm{s}}{\rm{t}}{\rm{a}}{\rm{t}}{\rm{u}}{\rm{s}}+{\rm{s}}{\rm{c}}{\rm{a}}{\rm{l}}{\rm{e}}({\rm{B}}{\rm{M}}{\rm{I}})\\ +{\rm{s}}{\rm{c}}{\rm{a}}{\rm{l}}{\rm{e}}({\rm{H}}{\rm{g}}{\rm{b}}{\rm{A}}1{\rm{c}})+{\rm{s}}{\rm{c}}{\rm{a}}{\rm{l}}{\rm{e}}({\rm{E}}{\rm{p}}{\rm{w}}{\rm{o }}{\rm{r}}{\rm{t}}{\rm{h}}{\rm{\_}}{\rm{S}}{\rm{c}}{\rm{o}}{\rm{r}}{\rm{e}})+{ \rm{s}}{\rm{c}}{\rm{a}}{\rm{l}}{\rm{e}}({\rm{I}}{\rm{C}}{\rm{V}})\end{array}$$
P.Individual variable values from GLM analyzes were corrected for multiple comparisons using the Benjamini–Hochberg procedure to control false discovery rate (FDR).
In the ABC study (n= 256), metabolic and sleep covariates (body mass index (BMI)), HgbA1c and Epworth sleepiness score) were not available; we therefore modeled the natural logarithm of the volume of each subregion (log (subregion volume)) as a function of age scaled on MRI, sex, cognitive state, state of amyloid-β deposits, their interaction and ICV:
$$\begin{array}{c}\log ({\rm{v}}{\rm{o}}{\rm{l}}{\rm{u}}{\rm{m}}{\rm{e}})\sim {\rm{s}}{\rm{c}}{\rm{a}}{\rm{l}}{\rm{e}}({\rm{a}}{\rm{g}}{\rm{e}}\,{\rm{a}}{\rm{t} }\,{\rm{M}}{\rm{R}}{\rm{I}})+{\rm{s}}{\rm{e}}{\rm{x}}+{\rm{c}}{rm{o}}{\rm{g}}{\rm {n}}. rm{l}}{\rm{o}}{\rm{i}}{\rm{d}}.\,{\rm{s}}{\rm{t}}{\rm{a}}{\rm{t}}{\rm{u}}{\rm{s}}\+{\rm{c}}{\rm{o}}{\rm{g}}{\rm{n}}.\,{\rm{s}}{\rm{t}}{\rm{a}}{\rm{t}}{\rm{u}}{\rm{s}} :{\rm{a}}{\rm{m}}{\rm{y}}{\rm{l}}{\rm{o}}{\rm{i}}{\rm{d}}.\,{\rm{s}}{\rm{t}}{\rm{a}}{\rm{t}}{\ rm{u}}{\rm{s}}+{\rm{s}}{\rm{c}}{\rm{a}}{\rm{l}}{\rm{e}}({\rm{I}}{\rm{C}}{\rm{V}})\end{array}$$
In the harmonized pooled cohort of two studies (AMBR + CBA, n= 458), we modeled the natural logarithm of the volume of each subregion as a function of age at MRI, sex, cognitive status, amyloid-β deposition status, their interaction, ICV, and study of origin. The above metabolic and sleep covariates were not included here because they were not available in both studies:
$$\begin{array}{c}\log ({\rm{v}}{\rm{o}}{\rm{l}}{\rm{u}}{\rm{m}}{\rm{e}})\sim {\rm{s}}{\rm{c}}{\rm{a}}{\rm{l}}{\rm{e}}({\rm{a}}{\rm{g}}{\rm{e}}\,{\rm{a}}{\rm{t} }\,{\rm{M}}{\rm{R}}{\rm{I}})+{\rm{s}}{\rm{e}}{\rm{x}}+{\rm{c}}{rm{o}}{\rm{g}}{\rm {n}}. rm{l}}{\rm{o}}{\rm{i}}{\rm{d}}.\,{\rm{s}}{\rm{t}}{\rm{a}}{\rm{t}}{\rm{u}}{\rm{s}}\+{\rm{c}}{\rm{o}}{\rm{g}}{\rm{n}}.\,{\rm{s}}{\rm{t}}{\rm{a}}{\rm{t}}{\rm{u}}{\rm{s}} :{\rm{a}}{\rm{m}}{\rm{y}}{\rm{l}}{\rm{o}}{rm{i}}{\rm{d}}. {\rm{I}}{\rm{C}}{\rm{V}})+{\rm{s}}{\rm{t}}{\rm{u}}{\rm{d}}{\rm{y}}\end{array}$$
To test whether the association between age and subregion volume differed by disease state, we fitted a separate GLM that included an age × group interaction term, where group distinguished cognitively normal and amyloid-negative individuals from all others:
$$\log ({\rm{volume}})\sim {\rm{scale}}({\rm{age}}\,{\rm{at}}\,{\rm{MRI}})\times {\rm{AD}}{\rm{\_}}{\rm{group}}+{\rm{sex}}+{\rm{scale}}({\rm{ICV}})+{\rm{study}}$$
To compare subregion volumes between AD patients and non-AD individuals while balancing demographic differences, we constructed a logistic regression model to estimate each participant’s propensity score to be in the AD group, using sex and age at MRI as covariates. Propensity score matching was then performed using a nearest neighbor algorithm, generating matched pairs of AD patients and non-AD individuals with similar gender and age distributions. This balanced these key covariates between groups for subsequent volumetric comparisons.
To evaluate the predictive power of hypothalamic volumes in identifying AD and cognitive status, we performed a series of binary classification tasks using receiver operating characteristic analysis. Three main target conditions were defined: (1) cognitive status (impaired “A” vs. normal “N,” (2) amyloid status (positive “P” vs. “N negative)) and (3) a composite group of AD (A+P.+ against all others). For each pathology, we compared the diagnostic performance of two distinct feature sets: a multivariate model including 13 individual hypothalamic subregions (ARC, anterior hypothalamic area, dorsal periventricular nucleus, DMH, lateral hypothalamus, medial preoptic nucleusMPO, paraventricular nucleus, posterior hypothalamus, periventricular…
Gn Health