
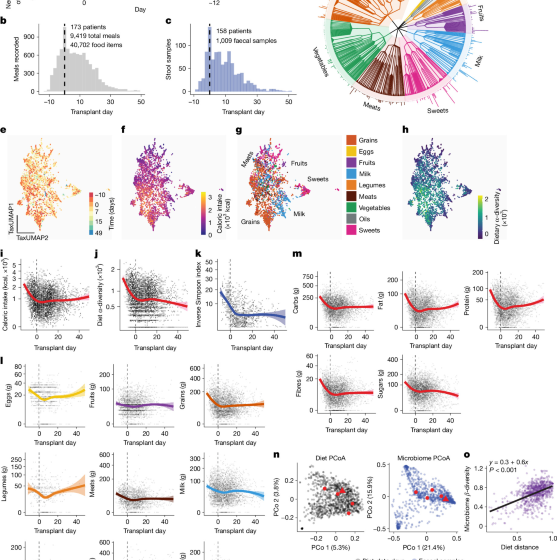

Patients
In this cohort study of adult recipients of allo-HCT at Memorial Sloan Kettering Cancer Center in New York between 2017 and 2022, eligible participants were admitted for Allo-HCT. Three times a week, patients recently admitted for allo-HCT were invited to participate in the collection of dietary intake. Neutrophil engraftment was defined as the first of 3 days when the neutrophil count was ≥500 per μl. Five patients died without achieving engraftment and were excluded from the analysis of median time to engraftment. No patient was lost to follow-up. For the mortality analysis, one patient died before historic day 12 and was excluded from this analysis. The last tracking/data collection date was April 2023.
Collection and annotation of nutritional data
The hospital’s kitchen commercial computer system (Computrition) was configured to provide a printout accompanying each bedside meal tray, on which patients were asked to indicate, immediately after each meal, whether they consumed 0, 25%, 50%, 75%, or 100% of each item they ordered for that meal. These instruments were collected by a dietitian or other members of the research team three times per week, during which missing entries were completed at the bedside, accompanied by encouragement to maintain motivation for the project. Consumption data was entered into the kitchen software, which was linked to the recipe and mass of each item. Data were manually checked by a research dietitian for quality control purposes (e.g., wildly implausible kcal values resulting from sporadic typographical errors in hospital kitchen logs). Usual dietary habits before admission were not studied; the analysis focused on the dietary intake of hospitalized patients. Per-patient intercept terms were included in the Bayesian model (see below), which can capture inter-patient variability in unmeasured parameters such as patient-specific dietary habits before transplantation.
An eight-digit food code was assigned to each unique food according to the FNDDS classification.46. Number codes are structures such that the following number positions differentiate foods within larger groups. For example, in the food code 14109010 for Swiss cheese, the first number, 1, designates milk and dairy products; the second number, 4, designates cheeses; and each subsequent digit conveys progressively higher resolution food classifications. We removed the water content from the total weight of the food before analysis. To calculate the dehydrated weight of foods consumed, we subtracted the water content, derived from FNDDS water fractions, from the total weight of foods. However, for EN, which is administered in liquid form and does not have a standardized total weight in grams, we used an additive approach. The dehydrated weight of these enteral formulations was calculated by adding the total weight in grams of their protein, lipid, and carbohydrate components. This approach allows for a more accurate comparison of nutrient intake between individuals and different food types because it eliminates the variability introduced by water content. Therefore, when we refer to each 100 g increase in sweets, we are referring to 100 g of the dehydrated weight of foods belonging to the “sweets” category. This ensures that we are comparing the actual nutrient content, including sugar, rather than the total weight or volume of foods consumed. The analyzed dataset therefore listed the dehydrated weight in grams of FNDDS foods consumed at each meal on each day of hospitalization.
Building food trees
A food tree was constructed with the 622 unique FNDDS items consumed by patients in this cohort, as has been done previously.7 (https://github.com/knights-lab/Food_Tree). The tree covers nine major FNDDS food groups, namely cereal products (abbreviated here as cereals); vegetables; meat, poultry, fish and mixtures (abbreviated here as meats); milk and dairy products (abbreviated here as milk); sugars, candies and drinks (abbreviated here as candies); fruits; dried beans, peas, other legumes, nuts and seeds (abbreviated here as legumes); fats, oils and dressings (abbreviated here as fats); and eggs. In some cases, food products not explicitly classified in the FNDDS contained ingredients from more than one category (such as the milk-based mango smoothie). We solved this problem by manually categorizing foods based on which FNDDS food description they best match. For example, a milk-based mango smoothie, although it contains mango, fits the description of “11553110 fruit smoothie, with whole fruit and dairy”; it was therefore classified in the “milk and dairy products” group.
Analysis of food data: TaxUMAP and dietary α-diversity
The hierarchical organization of the FNDDS vocabulary facilitated the application of α-diversities to diet data using Faith’s phylogenetic distance.47which was implemented in Qiime2 (qiime2-2021.11)48 using the alpha-phylogenetic diversity function qiime with the Faith_pd metric. The taxonomy of the food tree was used, as well as the dehydrated weight consumption of the food represented by the food code per patient per day. The TaxUMAP method4 was used to visualize compositional similarities between patients’ daily meals, similar to β-diversity. The fraction of each food consumed represented by a food code per patient per day was used to calculate the food tree taxonomy. Trends in microbiome dynamics and nutrition over time (Fig. 1i–k) were analyzed by GEEs using the geeglm function of geepack (v.1.3.9) in R.
Analysis of the human fecal microbiome
The fecal sample inclusion criteria and study progress are detailed in Figure 1a of the extended data. Samples were transported from the inpatient transplant unit to the laboratory via a pneumatic tube system at room temperature, rapidly refrigerated, and then aliquoted and frozen at −80°C within 1 business day. Microbiome profiling by 16S rRNA sequencing was performed at the MSK Molecular Microbiology Facility as described49. Briefly, bacterial cell walls were disrupted and nucleic acids isolated by silica bead beating and phenol-chloroform extraction, and the V4–V5 variable region of the 16S rRNA gene was amplified. Amplicons were purified using the Qiagen PCR purification kit (Qiagen) or AMPure magnetic beads (Beckman Coulter) and quantified using the Tapestation instrument (Agilent). No enrichment of microbial DNA was carried out. DNA was pooled at equal final concentrations for each sample and then sequenced on the Illumina platform. Of the 1,009 human fecal samples in this study, 42 were sequenced more than once. The median Bray-Curtis distance between distinct microbiome profiles generated from these same samples was 0.01, which was significantly lower than the distance between samples from the same patients collected on different days (median value 0.54; P. < 0.0001) and also smaller than the distance between samples from different patients (median value, 0.89; P. < 0.0001). This suggests that biological differences explain much more variation in composition than variations in technical sequencing. The median read count was 132,978 and the range was 1,196 to 8,698,524. 16S sequencing data were analyzed using the R package pipeline DADA2 (v.1.16.0) with default parameters except maxEE=2 and truncQ=2 in the filterandtrim() function.5016S FASTQ files were limited to 105 readings per sample. ASVs were annotated according to the NCBI 16S database using BLAST51. Microbiome α-diversity was assessed using the inverse Simpson index, a summary statistic of bacterial community richness and evenness. Taxa abundances were summarized at the genus level.
Relationships between microbiome α-diversity and clinical factors such as conditioning intensity, exposure to antibiotics, sweets, and parenteral nutrition were analyzed primarily using Bayesian models accounting for repeated sampling, time to transplantation, and other patient-level variables (see “Multilevel Bayesian Model” section below). To facilitate visualization of relationships in the unadjusted raw data set, α-diversity values in various subsets of samples are plotted as bee swarm plots in the extended data, Figure 1f.
Addressing taxonomic heterogeneity within the Enterococcus genre and model which E. faecium is the most commonly dominant species in this dataset (Extended Data Fig. 7d), we constructed a hybrid taxonomic feature table for β-diversity analysis in Extended Data Fig. 7d. 3. In this table of taxonomic characteristics, the species Enterococcus the genre has been divided into two distinct characteristics: (1) Enterococcus ASV_1 (identified as E. faecium through paired shotgun sequencing in a subset of samples (extended data, Figures 7c,d), and (2) a composite feature containing all other non-ASV 1 Enterococcuscombined bed. All other taxa were grouped at the genus level. β-Diversity was calculated using the Bray–Curtis dissimilarity metric on this hybrid feature array. For visualization, samples were classified as dominated if the relative abundance of a single feature (including division Enterococcusfeatures) exceeded 30%.
Sequencing and analysis of the mouse 16S rRNA gene
Mouse stool samples were sequenced using the ZymoBIOMICS targeted sequencing service (Zymo Research). DNA was extracted using the ZymoBIOMICS-96 MagBead DNA kit (Zymo Research) on an automated platform. The V3–V4 region of the bacterial 16S rRNA gene was amplified using the Quick-16S NGS Library Prep Kit (Zymo Research) with custom primers designed for optimal coverage and sensitivity. PCR reactions were carried out in real-time PCR machines to control cycles and limit chimera formation. The final pooled library was cleaned, quantified, and sequenced on the Illumina NextSeq system with the P1 Reagent Kit (600 cycles) using a 30% PhiX peak. ZymoBIOMICS microbial community standards were included as positive controls for DNA extraction and library preparation. Negative controls were also included to assess contamination. Bioinformatics analysis was performed as described in the following sections.
ASV inference
Unique ASVs were inferred from raw reads using the DADA2 pipeline50with removal of potential sequencing errors and chimeric sequences.
Taxonomic classification
Taxonomy assignment was performed using QIIME’s Uclust (v.1.9.1)52 with the Zymo research database as a reference. α-Diversity metrics were calculated using QIIME v.1.9.1. PCoA was carried out using the vegan package (v.2.5-7)53 to visualize…
Gn Health