

Chemicals and materials
PS microplastic powder with pristine surfaces was purchased with standard analytical grade from Sigma-Aldrich. PS microplastics of different morphologies were purchased from Thermo Fisher and Chem-Impex. The surface purity of PS model microplastics was characterized by X-ray photoelectron spectroscopy (PHI Versaprobe II X-ray photoelectron spectroscopy) before subsequent experiments. PE, PMMA and PVC were obtained in micrometric powder form from Sigma-Aldrich. PET and PP powders were purchased from Goodfellow and Magerials Science, respectively.
Rh800 was obtained from Sigma-Aldrich. DMPO was purchased from TCI America. Triton X-100, methyl orange, and ThT were obtained from Thermo Fisher. APF (Thermo Fisher Scientific) was obtained as 5 mM stock in N,N-dimethylformamide (DMF) and freshly diluted with phosphate-buffered saline (PBS; pH 7.4) to working concentrations before imaging for robust quantification of fluorescence under the microscope. R-PE conjugate (BioLegend) and WGA–Alexa Fluor 647 (Thermo Fisher Scientific) were used as a model of charged biomolecules to visualize the distribution on a plastic surface. Alexa 660-labeled single-stranded DNA (5′-Alexa 660-CAC GCG AAG ACT TAA GAT A-3′) was synthesized and purified by Integrated DNA Technologies.
All aqueous solutions were prepared using Milli-Q ultrapure water (18.2 MΩ·cm). The solvents including methanol (MeOH), ethanol (EtOH), acetonitrile (MeCN), and DMF were of HPLC grade. Standard buffers and salts (NaCl, FeCl2NaOH, triethylammonium acetate, and trifluoroacetic acid) were purchased from Sigma-Aldrich unless otherwise noted.
Microscopy consumables, including glass coverslips, were pre-cleaned with piranha solution (3:1 H2SO4:H2Oh2) followed by rinsing with plenty of water unless otherwise indicated. Disposable cuvettes were used for zeta potential measurements with a Malvern ZS Nanosizer instrument.
Degradation of methyl orange
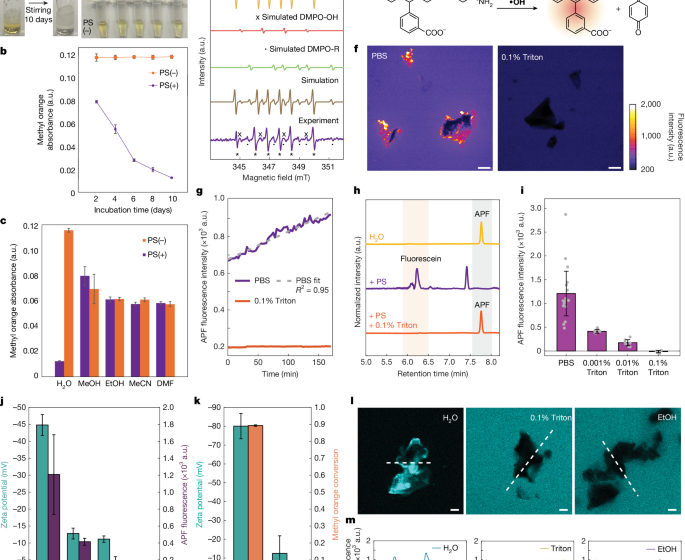
A solution of methyl orange (20 µM) was prepared with different solvents (i.e. H2O, MeOH, EtOH, MeCN and DMF) and mixed with PS powder (Sigma-Aldrich) at 10 mg ml−1 concentration. The suspension or solution obtained was kept stirring at room temperature at a stirring speed of 900 rpm for 10 days. Aliquots were taken every 2 days to monitor possible degradation of methyl orange. The suspensions were centrifuged at 16,000 rpm for 3 min to obtain the supernatant. The absorbance of methyl orange was calculated as OD465nm–OD700nm where OD465n.m. and D.O.700nm are the optical densities measured at 465 and 700 nm respectively. Subtraction of OD700nm corrected for the background signal, including residual particle scattering. Supernatants were measured in three replicate technical wells (100 μl per well) using a 96-well plate reader. A methyl orange solution prepared with the same solvents at the same concentration without addition of PS was stored under the same conditions and monitored at the same time as the controls.
ESR measurements
DMPO was used to scavenge radicals for ESR spectroscopy detection. To analyze the spontaneous formation of radical species at the PS-water interface, 200 mg of PS powder was mixed with a solution of 20 mM DMPO in water. The suspension was incubated at room temperature for 20 min before filtration to collect the filtrate. The resulting filtrate was transferred to a Wilmad Glass flat quartz cell for ESR spectroscopy measurements. The spectra were acquired at room temperature with a Bruker ELEXSYS E500 EPR spectrometer under the following conditions: microwave power 20.23 mW; 12 analyzes on average; central field 3,480 G; scanning width 100 G; modulation amplitude 1 G; microwave frequency 9.768037 GHz.
APF radical detection test
Confocal fluorescence imaging
PFA (5 mM; Thermo Fisher) was diluted to 5 μM using PBS. Then, 1 ml of 5 μM APF was mixed with approximately 1 mg of microplastic particles (PP, PS, PE, PET, PVC or PMMA) by vertexing. Aliquots of the mixture were sandwiched in a glass chamber consisting of an imaging spacer separating the glass coverslip treated with the piranha solution. Confocal fluorescence imaging was performed immediately after sample preparation. The green fluorescence channel was excited with an argon laser at 488 nm and the emission was collected in a band of 505–520 nm. Time-lapse images were acquired every 3 min with the excitation power optimized to minimize photobleaching and other disturbances during in situ tracking of the fluorogenic APF signal.
For quantification of the APF assay endpoint, mixtures containing 5 µM APF and approximately 1 mg microplastic particles (PP, PS, PE, PET, PVC, or PMMA) were first dispersed by vortexing and then incubated in the dark at room temperature for 90 min to allow the fluorogenic reaction to progress at the plastic-water interface. After incubation, aliquots of each sample were mounted in imaging chambers composed of a poly-I-a coverslip covered with lysine (Neuvitro) and a glass slide separated by a spacer. Fluorescence images were acquired with constant laser power, photomultiplier tube (PMT) voltage, detector gain, and pinhole size across all measurements to ensure quantitative comparability. Multiple non-overlapping fields of view were imaged for each polymer type to account for potential spatial heterogeneity in the fluorescence signal distribution.
Quantification of APF fluorescence was performed after generating maximum intensity Z projections of the acquired confocal stacks. Particle regions of interest were segmented using corresponding stimulated Raman scattering (SRS) images as references to precisely define particle boundaries. Fluorescence intensities were then extracted as area-weighted averages of the segmented regions of interest to represent the relative reactivity of each microplastic type.
SRS Imaging
We used SRS imaging to characterize microplastics as well as confocal imaging analysis54. SRS imaging was performed on a confocal laser scanning microscope (FV1200, Olympus) integrated with custom laser sources. A commercial laser system (PicoEmerald S, Applied Physics & Electronics) provided both the pump and the Stokes beams. The Stokes wavelength was set at 1031.8 nm and modulated at 20 MHz by an electro-optical modulator, while the pump beam was tunable and set at 784.2 nm to excite the CH vibration modes characteristic of microplastics. The two beams, with a pulse width of approximately 2 ps and a repetition rate of 80 MHz, were spatially and temporally synchronized and tightly focused on the sample using a ×25 water immersion objective (XLPlan N, 1.05 NA MP, Olympus). The transmitted beams were collected by an oil-immersion condenser with a numerical aperture of 1.4, with the Stokes beam removed by a high optical density bandpass filter (890/220 CARS, Chroma Technology). The transmitted pump beam was detected by a silicon photodiode (S3590-09, Hamamatsu) under bias of 64 V. The photodiode output was terminated via a 50 Ω load and demodulated using a high-frequency lock-in amplifier (HF2LI, Zurich Instruments) at 20 MHz. The demodulated pump loss signal was digitized and fed to analog input channel FV10 to generate SRS images.
HPLC analysis
An Agilent 1200 series system equipped with a Vydac 218TP-C18 column (250 × 4.6 mm, 5 μm; Grace) was used for HPLC analysis. The gradient was increased from 5% B to 95% B in 15 min (solvent A, water + 0.1 M triethylammonium acetate; solvent B, acetonitrile + 0.1% (v/v) trifluoroacetic acid). The detection unit was configured to monitor the reaction by absorbance at 488 nm. The peaks corresponding to APF and its oxidation product, fluorescein, were assigned based on the retention time measured from the standard solution.
To examine the conversion of APF in water upon addition of PS powder, 100 mg of PS powder was suspended in 1 mL of 20 µM APF solution in water with and without supplemented 0.1% Triton X-100. The suspension was left stirring in the dark for 16 h at room temperature before filtration to collect the filtrate for HPLC analysis. A positive control was prepared by mixing 20 µM APF with 20 mM H2Oh2 and 2 mM FeCl2 in water and incubated for the same duration before HPLC analysis.
Surface localization imaging test
Surface localization of the charged fluorophore
PS particles (1 mg ml−1) were suspended in 1 µM Rh800 prepared under different solvent conditions (i.e. H2O, 0.1% Triton X-100 in H2O and EtOH). Suspensions were incubated in the dark at room temperature for 10 min before confocal fluorescence imaging. The far-red channel was excited by a 635 nm laser with a collection band of 655–755 nm.
Surface localization of proteins
Plastic particles (10 mg ml−1) were mixed with proteins in PBS (0.02 mg ml−1) to image the absorption surface of the protein under confocal fluorescence imaging. Proteins with different net charges in the PBS environment were selected, with R-PE (Biolegend) being negatively charged and WGA (Thermo Fisher, W32466) being positively charged at pH 7.4. The mixture was vortexed and incubated in the dark for 15 min before an aliquot of the mixture was sandwiched in a glass chamber in the same manner with cover glass treated with piranha solution. WGA conjugated to Alexa Fluor 647 was imaged in the far-red channel, excited by a 635 nm laser with fluorescence collected between 655 nm and 755 nm. R-PE was imaged in the red channel, excited by a HeNe(G) laser (543 nm) with emission collected between 560 nm and 660 nm. Simultaneous imaging of the two channels revealed the different distribution patterns of oppositely charged proteins on the plastic surfaces.
Surface localization of DNA
Alexa 660-labeled DNA (500 nM; 5′-Alexa 660-CAC GCG AAG ACT TAA GAT A-3′, from Integrated DNA Technologies) was added to plastic particles (approximately 10 mg ml−1) to image surface adsorption of DNA…
Gn Health