
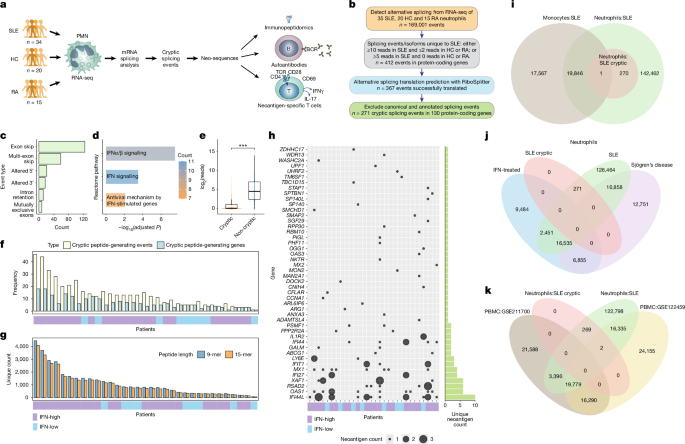
Patients with SLE
We obtained freshly collected blood from an adult (n= 34) SLE patients, healthy individuals (n = 20) and patients with rheumatoid arthritis (n= 15) to serve as disease control. Study participants were recruited through the University of Washington Division of Rheumatology biorepository to participate in research studies at the University of Washington Medical Center, Seattle, WA. The study was approved by the institutional ethics committee (STUDY00006196), the research was carried out in accordance with all applicable guidelines and regulations, and informed written consent was obtained from all participants in accordance with the Declaration of Helsinki.
The 34 SLE patients included in our study represent the typical spectrum of SLE seen in an academic medical center with standard medications (Supplementary Table 1). Eleven patients had active disease, defined as having a SLEDAI ≥ 6, while 24 had inactive disease with a SLEDAI < 6 at the time of venipuncture. Based on the 95th percentile of expression of 111 interferon-inducible genes in healthy donors, 26 were considered positive for the interferon signature. All healthy donors and patients with rheumatoid arthritis had a negative interferon signature.
Isolation of neutrophils and peripheral blood mononuclear cells
Polymorphonuclear cells (PMN) were isolated from freshly collected venous blood (within 1 hour of venipuncture) by gradient centrifugation on PolymorphPrep according to the manufacturer’s instructions. PMN fraction was 95% CD66b+ and 85% CD15+. Cells were washed and suspended in Hanks’ buffered saline at 10°C.7 per ml.
RNA isolation and RNA sequencing
RNA extraction was performed using the Quick-RNA Whole Blood kit (Zymo Research, R1201). Cells were lysed in DNA/RNA Shield and RNAs were isolated according to the manufacturer’s instructions and eluted in RNase-free water. RNA was sent to the UW Northwest Genomics Core for strand-specific paired-end RNA sequencing at 50 million 101-bp reads per sample.
Alignment to the reference genome and detection of alternative splicing
After quality control of the sequencing quality, the FASTQ files were aligned to the reference genome (GRCh38) using STAR (v2.7.9a)61 with a two-pass mode that improves detection of reads mapped to novel splice junctions. After post-alignment quality control, sorted and indexed BAM files were used to identify alternative splicing events by SplAdder (v3.0.3).62 which uses alignment and annotation data to create splicing graphs enriched with splicing events based on the provided RNA sequencing data, followed by quantification of splicing events. The software filters input alignment reads based on their quality and allows four confidence levels: we used the highest confidence setting. Additionally, this tool uses event-specific criteria to confirm splicing events based on genomic coordinates and coverage; we only included confirmed events in our analysis. Annotated and novel splicing events were detected, including six event types: exon skipping, 3′ or 5′ alternative splice site, intron retention, mutually exclusive exons, and multiple exon skipping.
Discovery and translation of an enigmatic alternative splicing
We detected cryptic alternative splicing in SLE, defined as splicing events with readthrough support in SLE neutrophils and either absence or rare readthrough support in healthy and RA controls. We used our established methodology (RiboSplitter24) to translate splicing events into peptide sequences to enable downstream analysis and validation. Splicing events with valid and unambiguous translations were used for downstream analyses.
Since an alternative splicing event includes two isoforms, we identified cryptic splicing events (both isoforms are cryptic), as well as cryptic splicing isoforms (one of the event isoforms is cryptic). We used strict filtering criteria as follows: first, we required that cryptic events and isoforms have ≥10 supporting reads in at least one SLE sample and no more than 2 supporting reads in each healthy or RA sample; or ≥5 additional readings in at least 1 SLE sample and no additional readings in each healthy or RA sample. Second, we excluded annotated splicing events and isoforms based on the GRCh38 reference. Third, cryptic peptides were excluded if there was a match between known annotated proteins in the gene. These filtering criteria add specificity to the detection of cryptic and neutrophil-specific SLE events.
We consistently calculated PSI values for isoform 2, such that a higher PSI always indicates a higher proportion of isoform 2, making it easier to interpret which group has the greatest number of isoforms.
Prediction of MHC affinity
We identified each MHC class I and class II haplotype for each SLE patient from RNA sequencing data using arcasHLA (v0.5.0), which was found to be highly accurate (100% accurate for MHC class I and 99.7% accurate for MHC class II).63. MHC affinity binding was predicted for cryptic SLE peptides using NetMHCpan-4.1 (mers length = 8-11) and NetMHCIIpan-4.026 (mers length = 14-16) which use neural networks trained on binding affinity as well as mass spectrometry data. Strong affinity binding was defined as a predicted affinity percentage ≤2% (relative to a set of 100,000 random natural peptides) with a predicted binding affinity <500.
HLA immunoprecipitation
Peptides that bind MHC class I were immunoprecipitated using a previously described method64. Briefly, HLA-A, HLA-B, and HLA-C (W6/32) or isotype antibody were conjugated to protein A magnetic beads (Millipore-Sigma) at 1 mg ml.−1. Cell lysate from 10 million cells was mixed with 100 μl of anti-HLA beads (or isotype control beads). After washing, the bound peptides were eluted with 0.2% trifluoroacetic acid, followed by cleaning on a C-18 column and subsequently analyzed by LC–MS.
LC-MS and analysis
Mass spectrometry was performed at the Proteomics Resource (UWPR) at the University of Washington. Peptide separation was carried out on a Thermo EASY-nLC system using a gradient from 120 min to 300 nl min−1. Mobile phase B was increased from 6% to 45% in 89 min, followed by a ramp to 100% B and column re-equilibration. Samples were loaded at 2.5 µl min−1. The mass spectrometric analysis was carried out on an Orbitrap Exploris 480 operating in positive ion mode. The complete mass spectrometry scans were acquired at a resolution of 120,000 (at m /z200) on a m/zrange from 375 to 1575, with a normalized AGC target of 200%. Targeted parallel reaction monitoring MS/MS scans were acquired at 30,000 resolution using high-energy collisional dissociation (HCD) fragmentation with a normalized collision energy of 30%. The isolation window has been set to 1.6m/z. Programmed acquisition windows from 0 to 120 minutes were used for the targeted precursor ions listed in the inclusion list. The individual peptide was further analyzed in Skyline65.
Visualization and processing of mass spectra
Skyline chromatogram data were imported and visualized using Skyline (64-bit) 24.1.0.199. Data were filtered to include only precursors with an idotp ≥0.85 and mass error <10 ppm. Then, the correspondence between the peak shape and retention time of the daughter ion spectra with those of the precursors was visually inspected and confirmed.
ELISA for neoantigen-specific IgG
Selected neoantigen peptides synthesized by Shanghai RoyoBiotechnology were spotted on medium binding EIA plates at 1 ng μl−1 in 0.1 M bicarbonate coating buffer, pH 9.5. Plates were then blocked in 2% BSA in 1× phosphate-buffered saline (PBS). Sera from SLE patients and healthy donors were added to the blocked wells, followed by anti-human IgG–horseradish peroxidase. TMB substrates were added to the wells and the reaction was stopped by 2N sulfuric acid solution. Absorbance at 450 nm and 630 nm was measured with a BioTek Synergy 2 plate reader.
Gene expression
We quantified gene expression using Rsubread featureCounts66 (v2.12.3). The average expression of 111 interferon-induced genes (ISGs)67 was calculated per sample, and SLE samples were considered to have elevated interferon signatures when mean ISG expression was above the 95% percentile of ISG expression in healthy controls.
Comparison with PBMC splicing
To test whether the cryptic splicing events we discovered in SLE neutrophils were also observed in PBMCs, we used two publicly available RNA sequencing datasets of PBMCs from SLE patients. A study (GSE122459)68 included 20 SLE patients and 6 healthy controls, and the other (GSE211700)69 included 20 SLE patients and 10 healthy controls. We ran the same analysis pipeline as described above to align the data and detect alternative splicing events. Next, we searched for cryptic splicing of SLE neutrophils in the PBMC datasets.
T cell activation test
PBMC (2 × 10⁶ per well) from SLE patients were cultured in 24-well plates in RPMI 1640 medium (Gibco, 11-875-093) supplemented with 5% autologous patient serum filtered with a syringe (0.22 μm), heat inactivated at 56°C for 20 min, and refiltered (0.22 μm). Cells were stimulated with 5 µg ml−1 peptide pools containing three to six neopeptides and supplemented with IL-2 (10 U ml−1; R&D, BT-002-050) on days 4 and 9. Positive controls consisted of stimulation with phytohemagglutinin-M (10 μg ml−1; Sigma, NC2034236) on day 1, followed by restimulation with Dynabeads CD3/CD28 (Gibco, 11131D) on day 14. Tetanus toxoid (Fisher Scientific/List Biological Labs, NC0603970) served as an additional positive control in a subset of experiments. On day 14, PBMCs were restimulated with individual peptides from each pool and ELISPOT plates were coated with capture antibodies for overnight incubation. After 18 to 24 h of coculture, triple aliquot of 3 × 10⁵ cells were resuspended in CTL medium supplemented with 1% L-glutamine (Gibco, 2503008), plated in coated ELISPOT wells and incubated for 4 h at 37 °C. Spots were developed using the CTL-Human IFN-γ/IL-17 Dual Color ELISPOT Kit according to the manufacturer’s instructions and quantified with a CTL S6 Universal M2 reader. The remaining cells were collected for analysis by flow cytometry.
Flow cytometry
After 14 days of stimulation, cells were transferred to a 96-well round-bottom plate and washed with 1× PBS. To prevent nonspecific binding, cells…
Gn Health