The U.S. economy is “overheating,” with strong growth in consumer spending and high inflation. The bond market sees it too

Particularly motivated was spending on discretionary goods and services that people buy for fun.
By Wolf Richter for WOLF STREET.
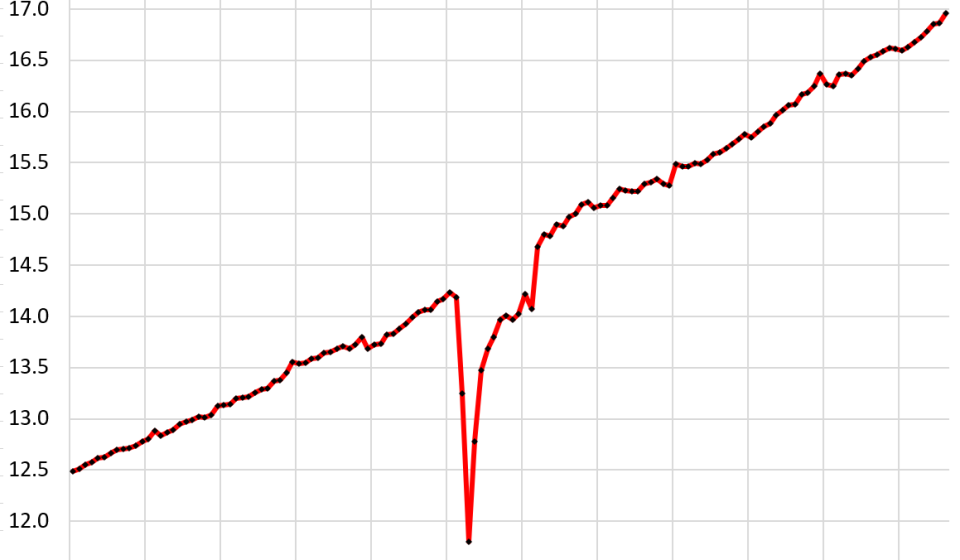
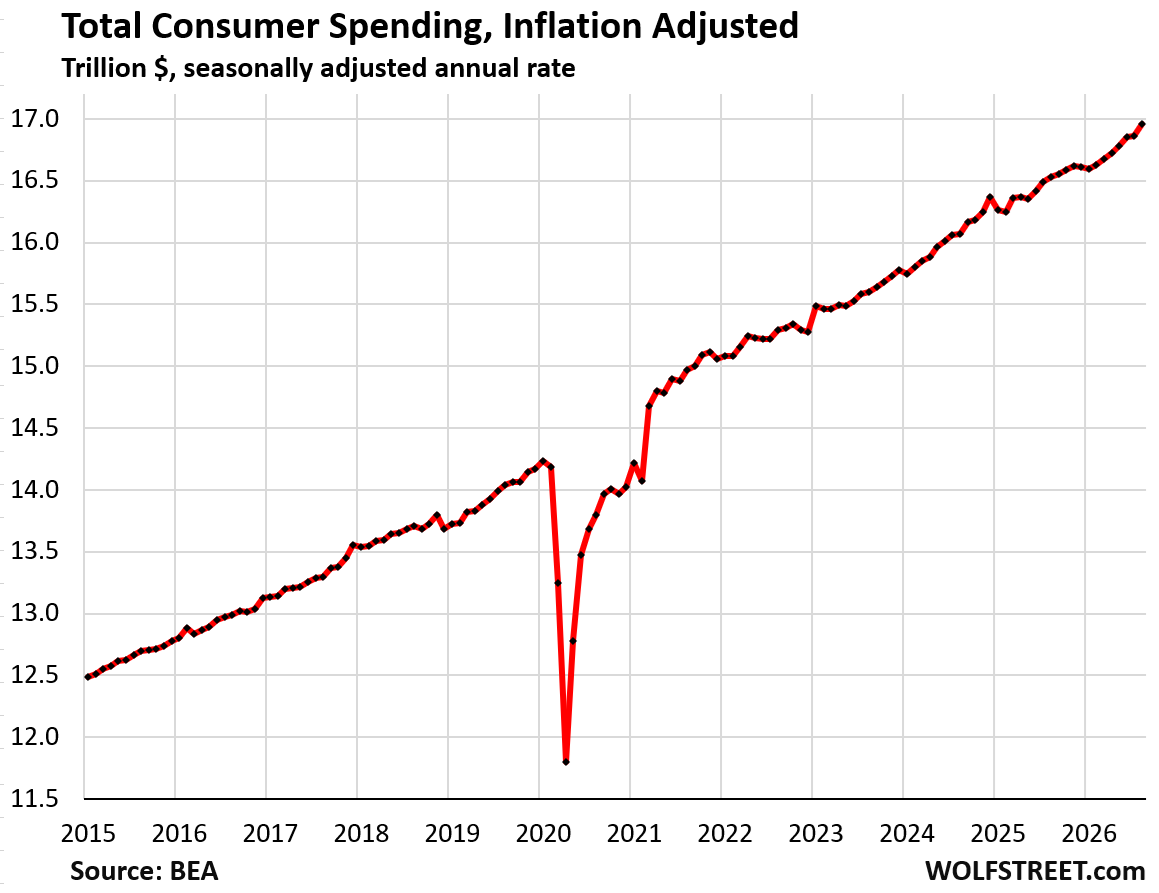
Adjusted for high inflation, consumer spending in August rose 0.55% month-over-month and 2.6% year-over-year, the Bureau of Economic Analysis reported today.
Americans have been spending despite soaring gas prices, talk from AI companies about AI will kill us all, geopolitical chaos in the headlines… you name it, we’ve got it – but no problem, spending must continue, including or especially on discretionary experiences, like restaurant meals and lodging, and on discretionary goods, like RVs.
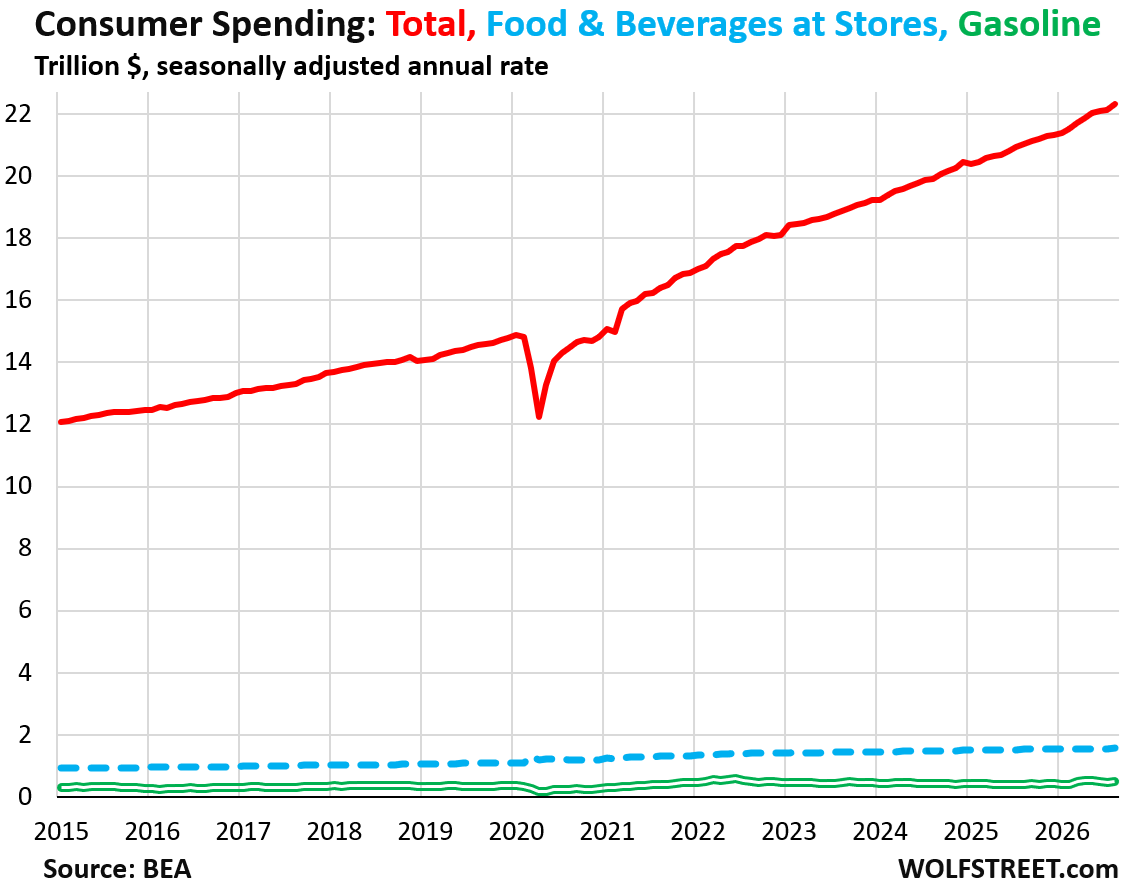
Not adjusted for inflationconsumer spending in August jumped 0.86% from July and 6.1% year-over-year, to an annual rate of $22.3 trillion (shown in red in the chart below).
These are big growth numbers, and we’ll see some bigger ones below, but there’s also been a lot of inflation. This is how an economy “fires on all cylinders” – lots of spending growth and lots of inflation.
Of the total amount spent:
- 69% was spent on services; half of this went to health services (excluding health products) and housing combined.
- 11% was spent on durable goods, such as automobiles, recreational vehicles, computers, furniture, appliances, etc.
- 20% was spent on non-durable goods, such as pharmaceuticals, food, gasoline, clothing, shoes, household items, etc.
Food and gasoline prices are constantly in people’s sight and when they rise they annoy them, but they represent a relatively small share of total consumer spending.
Spending on food and beverages in stores accounted for 7.0% of total consumer spending (dashed blue line). Gasoline and other energy goods represented 2.3% of total consumer spending, compared to 1.9% before the start of the price surge (double green line). This relatively small share of total spending actually explains why the recent gasoline price spikes and the 2021-2022 food and gasoline price spikes have not derailed the economy.
About inflation adjustments: Price changes for each good and service that are part of the consumer basket are tracked at this level, and spending on those goods and services is then adjusted for inflation by price changes for those specific goods and services.
For example, if gas prices increase by 10%, “real” gas spending is adjusted by 10% of the gas price changes. So, over time, inflation-adjusted gasoline sales are almost flat, with seasonal variations and a slight downward trend, roughly parallel to gasoline consumption in gallons.
And if rents increase by 2%, “real” rent expenses are adjusted by 2% in price variation.
Then the price changes for each product are combined and form the overall inflation rates.
So, to see where people are actually spending their money, we need to look at nominal spending, not adjusted for inflation.
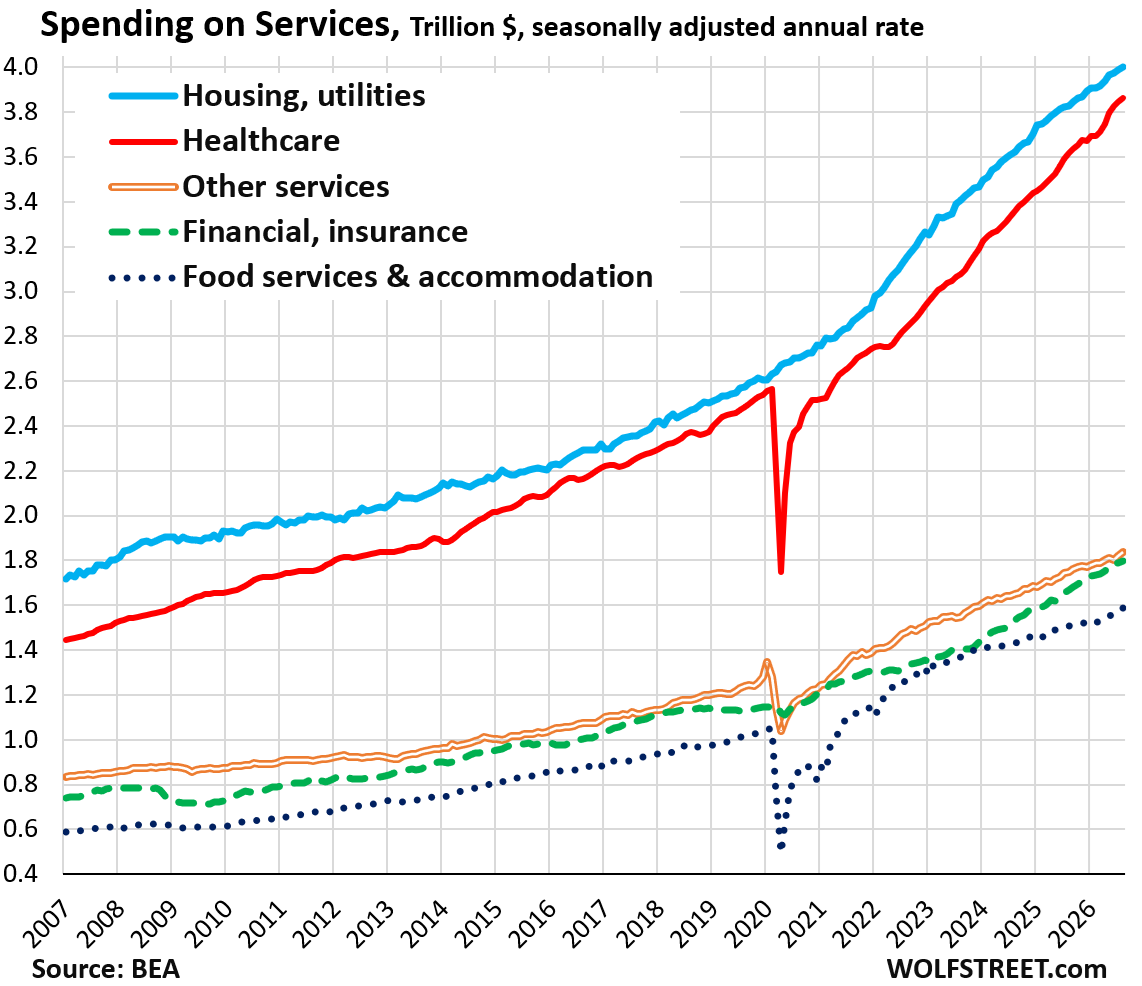
Spending on services, not adjusted for inflation rose 0.50% month-over-month and 5.9% year-over-year in August.
Spending on services is dominated by housing, which represents 17.9% of total consumption expenditure, and by health services (including health insurance but not health goods), which represents 17.3% of total expenditure.
Expenditures increased by:
- Housing and utilities: +0.26% monthly; +4.5% YoY (blue in the chart below).
- Health services: +0.39% monthly; +6.8% over one year (red).
- Other services: +1.03% monthly; +4.9% YoY (double gold).
- Financial services and insurance (excluding health insurance): +0.48% monthly; +7.6% YoY (large green dotted line).
- Catering and accommodation: +1.31% monthly; +5.2% over one year (small dark blue dotted lines).
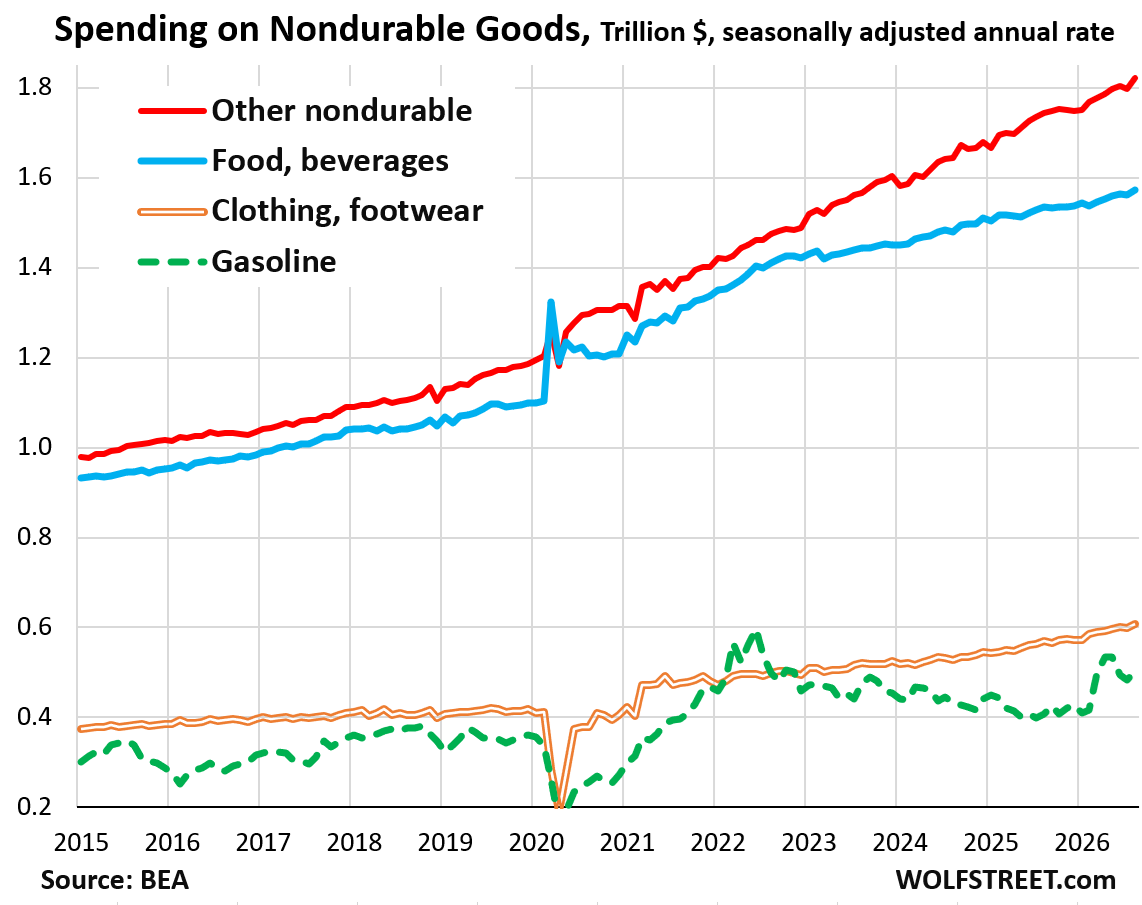
Spending on non-durable goods increased by 1.5% in August compared to July and by 5.9% year-on-year.
The main driver was gasoline due to soaring prices. When price spikes are taken into account, “real” gasoline spending (adjusted for gasoline price changes) has declined month-over-month and year-over-year.
Pharmaceuticals and medicines dominate the “Other non-durable goods” category. Additionally, this category includes games, toys, pet items, etc. ; household items; personal care products; tobacco products; magazines, newspapers…
Expenditures increased by:
- Other non-durable goods (mainly medical goods): +1.45% monthly, +4.5% year-on-year (red)
- Food and drinks purchased in stores: +0.74% monthly, +2.4% year-on-year (blue)
- Clothing and shoes: +1.5% monthly, +6.9% year-on-year (double gold)
- Gasoline: 4.3% monthly, +24% over one year (large green dotted line).
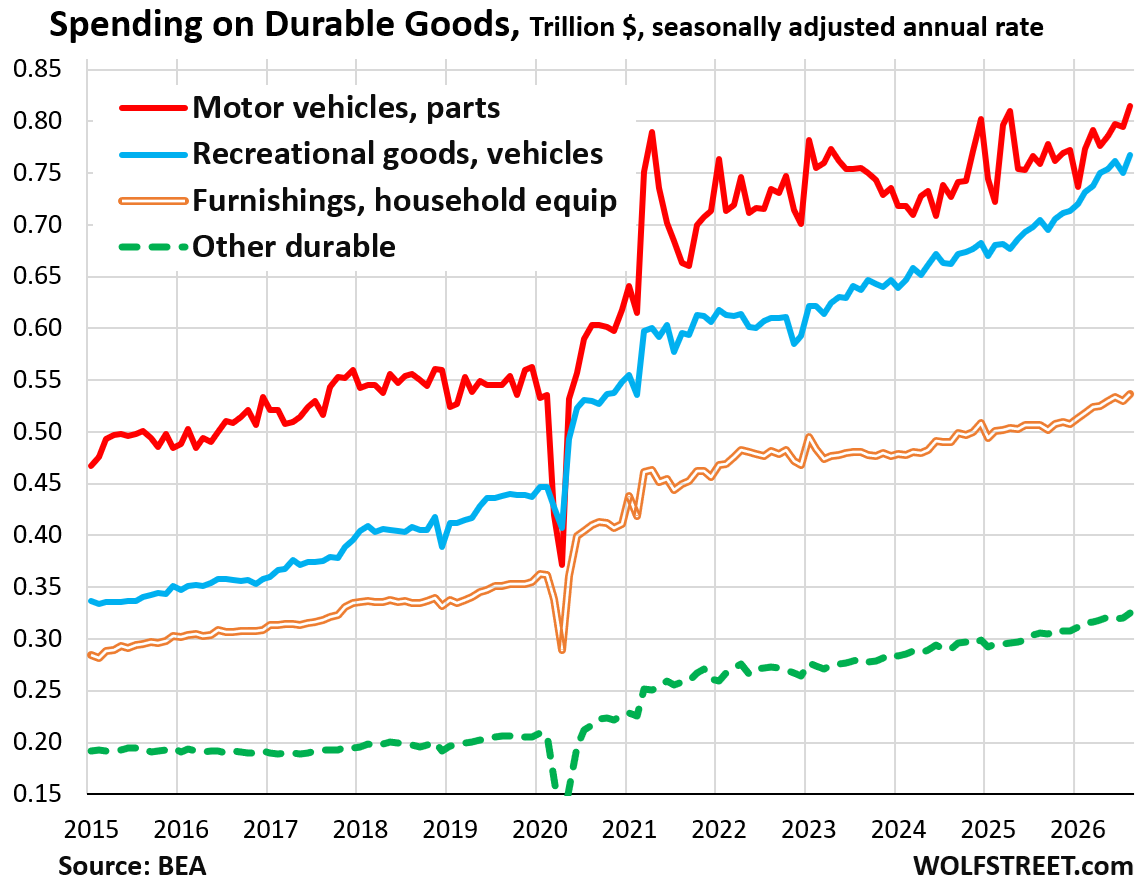
Spending on durable goods rose 2.0% month-over-month and 6.4% year-over-year, not adjusted for price changes.
“Recreational goods and vehicles,” the second category of durable goods, are what consumers buy for fun. These are discretionary expenses: ATVs, snowmobiles, motor homes, travel trailers, all-terrain motorcycles; video, audio and photographic equipment; computers, tablets and software used for entertainment purposes; bicycles; hunting, fishing and camping equipment; musical instruments; recreational books; and other stuff.
Expenditures increased by:
- Motor vehicles and spare parts: +2.5% month-on-month, +7.3% year-on-year (red).
- Leisure goods and vehicles: +2.3% monthly, +8.8% YoY (blue).
- Furniture and household equipment: +1.2% monthly; +5.9% YoY (double gold).
- Other durable goods: +1.3% monthly; +6.4% over one year (large green dotted line).
These dizzying rates of growth in consumer spending in a context of significant inflation show that the economy is “overheating”. This trend is also visible in businesses, where massive investments are now being made in infrastructure; For businesses, inflation, as measured by the PPI, has been significantly higher than for consumers. And of course, deficit spending by the federal government has been on the rise for years.
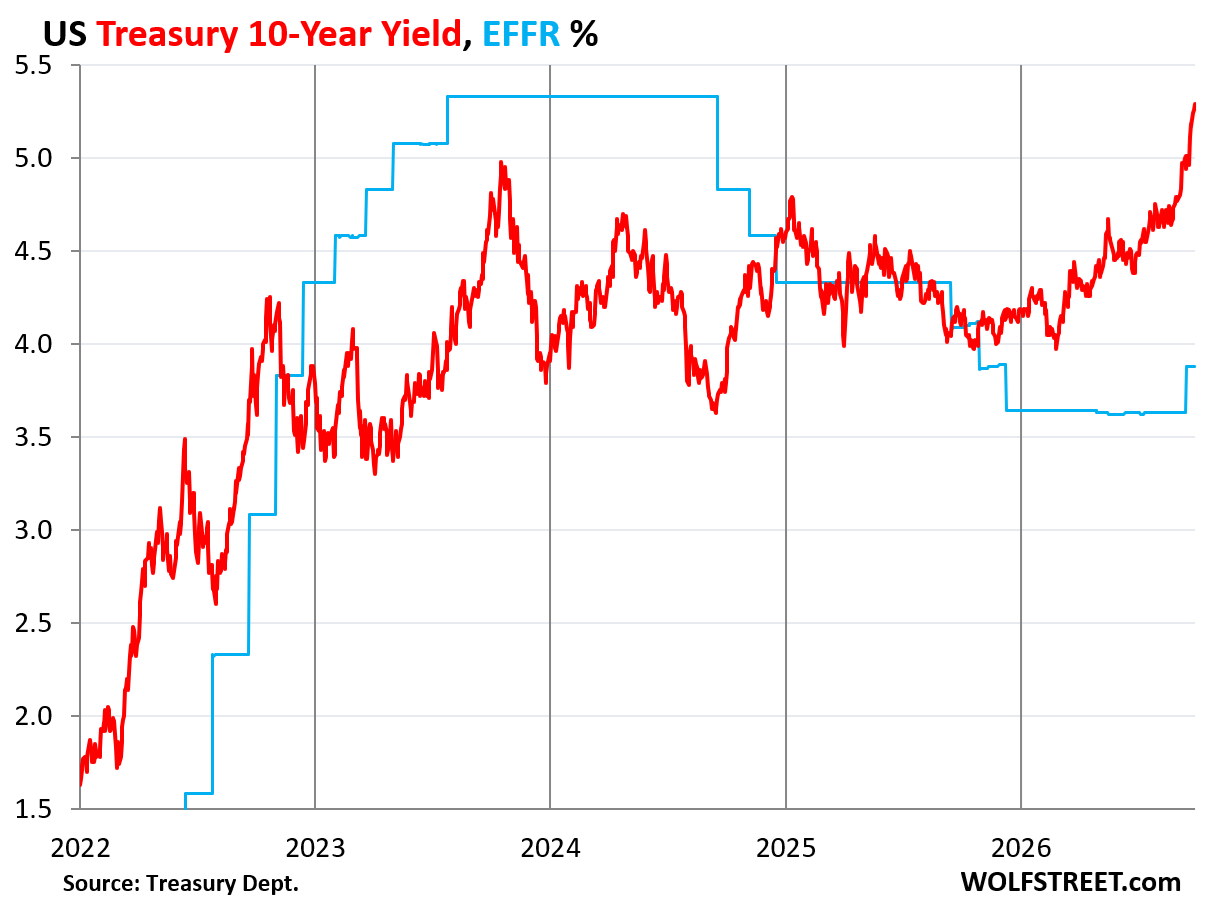
It’s a powerful blend. And the bond market is seeing it too. The 10-year Treasury yield rose today to 5.30%, a welcome return to the normal range, so to speak, the highest since mid-2007, just before the Fed’s interest rate crackdown and QE began systematically demolishing the bond market.
In case you missed it: Even massive methodology changes can’t bring PCE inflation back into the bottle
Do you like reading WOLF STREET and want to support it? You can make a donation. I appreciate it enormously. Click on the mug to find out how:


Gn bussni